


How to create a survey and perform Data Analysis
Analyzing data from surveys, and creating a dashboard visualization.


The ADA Program has brought me up to speed on data collection and visualization which I wish to share with tech enthusiasts today. Fortunately, I happen to be one of the members of a team called Njoku Ji, charged with the primary responsibility of developing a language learning platform, precisely the Igbo language. While the team comprises tech ADAs from other tracks like front-end development, Data Analysis, Product design, etc, the Data track was saddled with the responsibility of creating a comprehensive survey and building a dashboard for better comprehension.
This article will walk you through the steps involved in creating a survey to enable you to collect data, analyse the data, and build a comprehensive dashboard.
There are several ways of creating a survey but for this article, we will be making use of Microsoft forms.
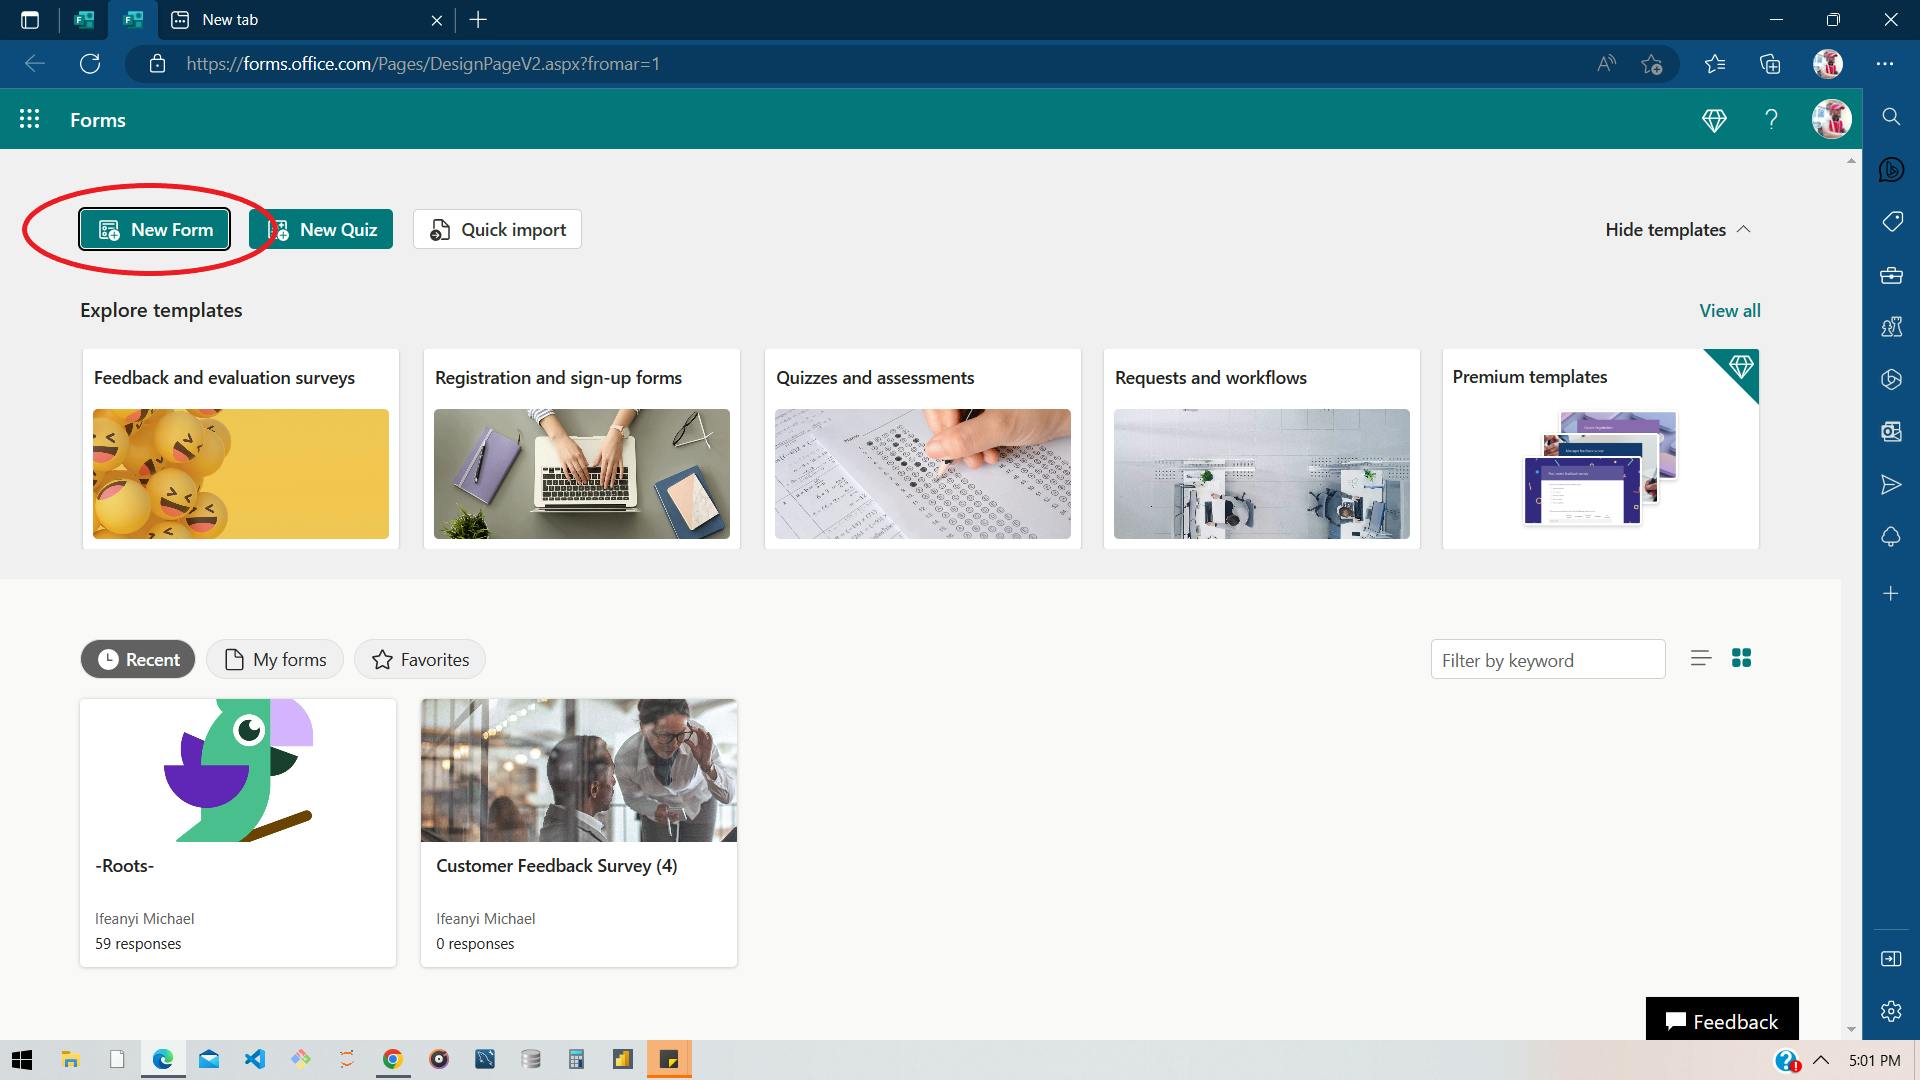
First, you need to create a Microsoft account.
Click the New Form option and then begin to customize and type your survey questions.
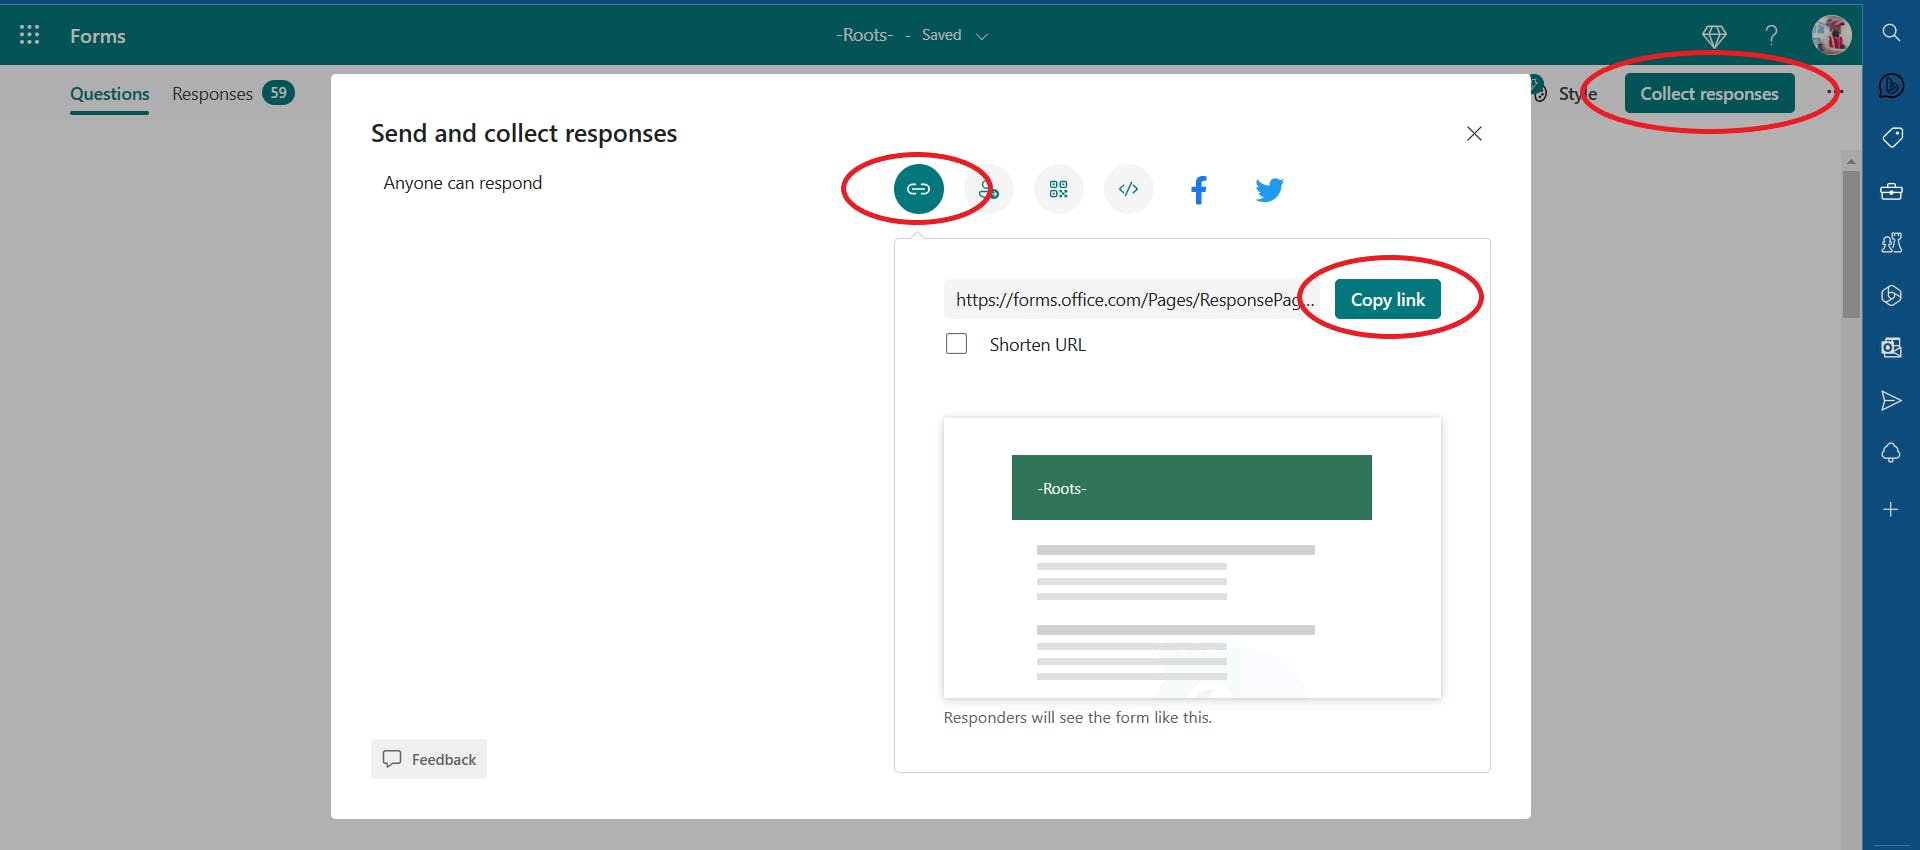
Once completed,
click on collect responses
copy the link and then share
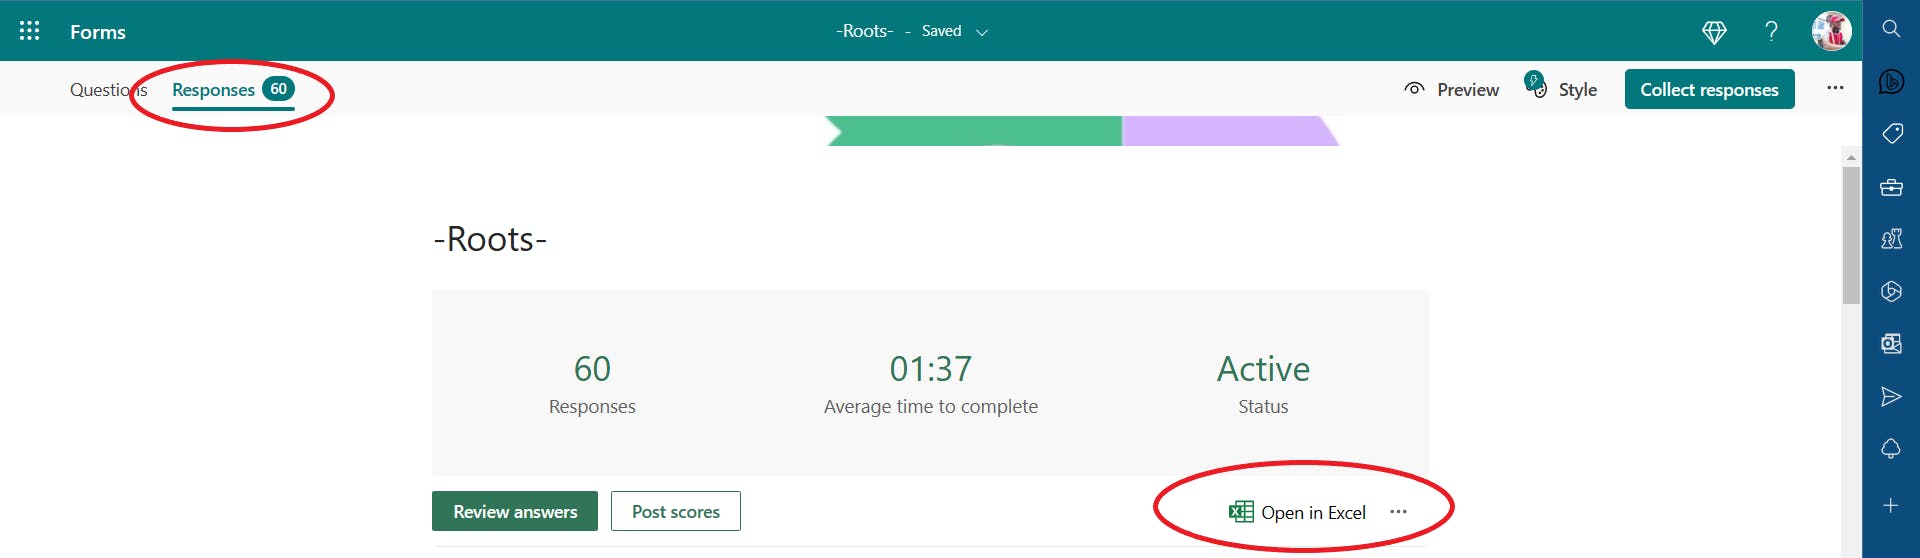
After collecting the survey data from random individuals, you can export it to excel to begin analysis as shown below;
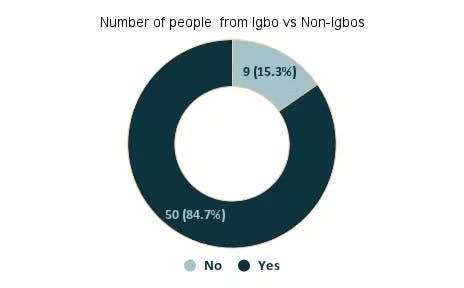
On excel, you can perform data cleaning by deleting rows and columns that are not necessarily required for your analysis and thereafter plot the graphs according to the data required.
eg. plotting a graph of how many Igbos against non-Igbos participated in the survey.
Once analysis is completed, you can create a dashboard to represent all data in a single visualization platform as seen below.
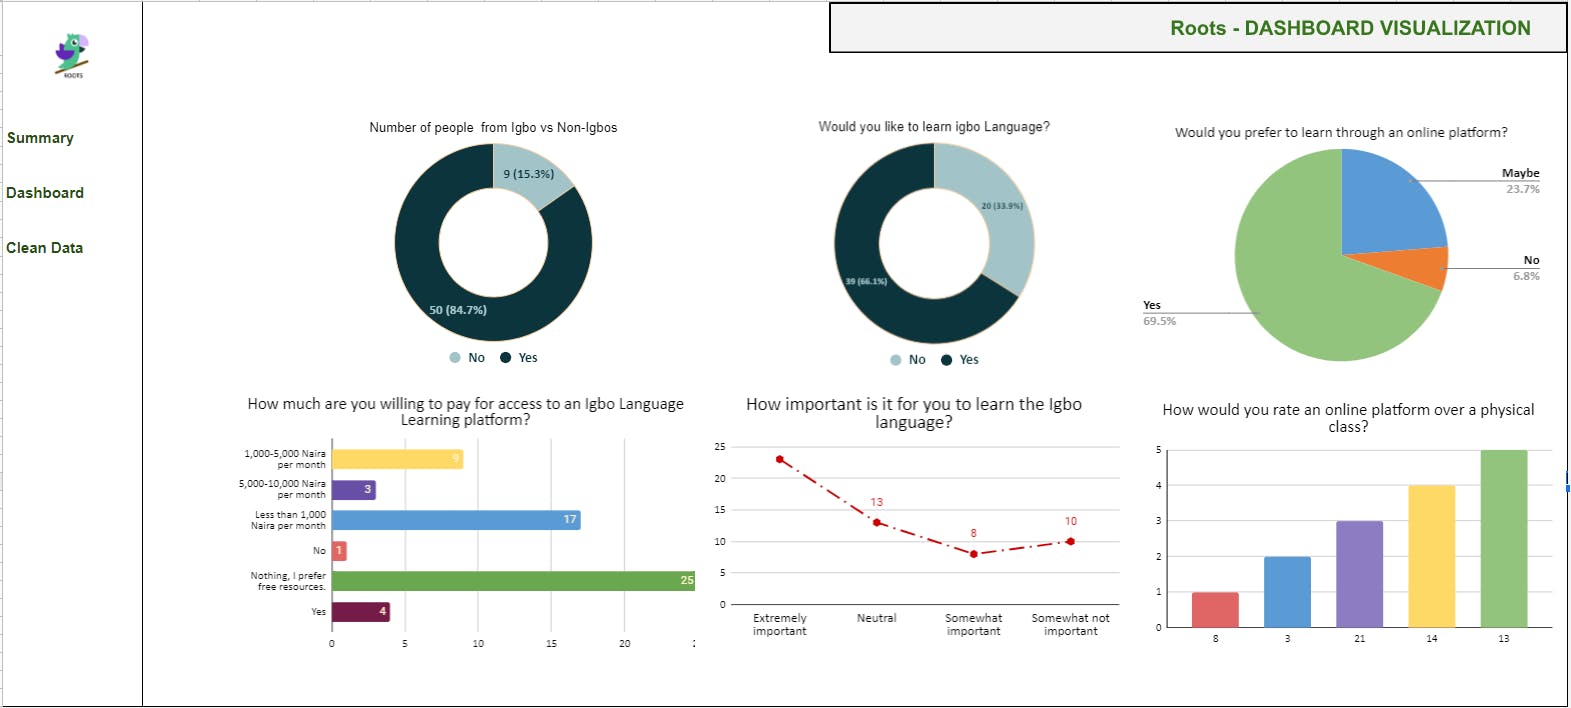
To learn more about data collection, analysis, and visualization kindly click here to join The ADA program.